So you signed up for an online course. You watched the videos, clicked through the slides, maybe even passed a quiz or two. But here is a question most people never think about: Does the platform actually know if you learned anything? Not just that you completed the course, but that something actually clicked?
This is the big problem with online education. A student can open a module, leave it running in another tab, and come back 40 minutes later to click “Next.” The system logs it as completed. But did any learning happen? Not really.
Modern platforms are getting much smarter about this. They are moving away from tracking simple clicks and completions, and instead trying to capture the moments where real learning actually takes place.
Why Clicking “Next” Tells You Almost Nothing?
Before getting into how platforms track good learning, it helps to understand what bad tracking looks like.
For years, most Learning Management Systems (LMS) measured progress by looking at three things: Did the student log in? Did they finish the module? Did they pass the test? That is it. No nuance, no depth.
The problem is that none of those things confirms understanding. A student can rush through ten screens in 90 seconds, guess their way through a multiple-choice quiz, and get a passing score. The system marks them as “complete.” The teacher sees a green checkmark.
The degree of interactivity directly impacts the quality of an eLearning course. That is not just an opinion. It is backed by research from instructional designers who have spent years studying what actually makes people retain information. Clicking through content passively is very different from wrestling with it actively.
So what does real learning look like when it is happening online? And how do platforms actually spot it?
What Platforms Actually Watch When You Study
Time Spent on Specific Sections, Not Just Total Session Time
Good platforms do not just log that a student spent 45 minutes in a course. They track exactly how long that person spent on each individual piece of content. A student who breezes through Module 3 in 30 seconds but spends 12 minutes re-reading Module 5 is telling the system something important. Module 5 is harder for them.
This kind of granular time-tracking lets instructors and systems identify which topics are confusing people and which ones students sail through. That is genuinely useful information.
Video Watching Habits
Not all video views are equal. Someone who watches a 10-minute explanation video straight through is having a different experience from someone who rewinds the same 90-second section four times.
Smart platforms track when students pause, when they rewind, when they skip, and when they replay. A cluster of students all rewinding the same moment in a video is a very clear signal. That moment probably contains something that needs to be explained better.
Drag-and-Drop Activities, Embedded Quizzes, and Virtual Labs
Interactive tools like quizzes, drag-and-drop exercises, and virtual simulations measure the active application of knowledge rather than passive reading. This is a big deal. A student who can answer a question about photosynthesis after reading about it is using memory. A student who has to build a diagram of the process, move parts around, and get feedback on mistakes is actually working with the material.
The difference in retention between those two experiences is significant. And the platform can see which students are actually engaging with those interactive elements versus skipping them.
How Platforms Read the Conversations Students Have
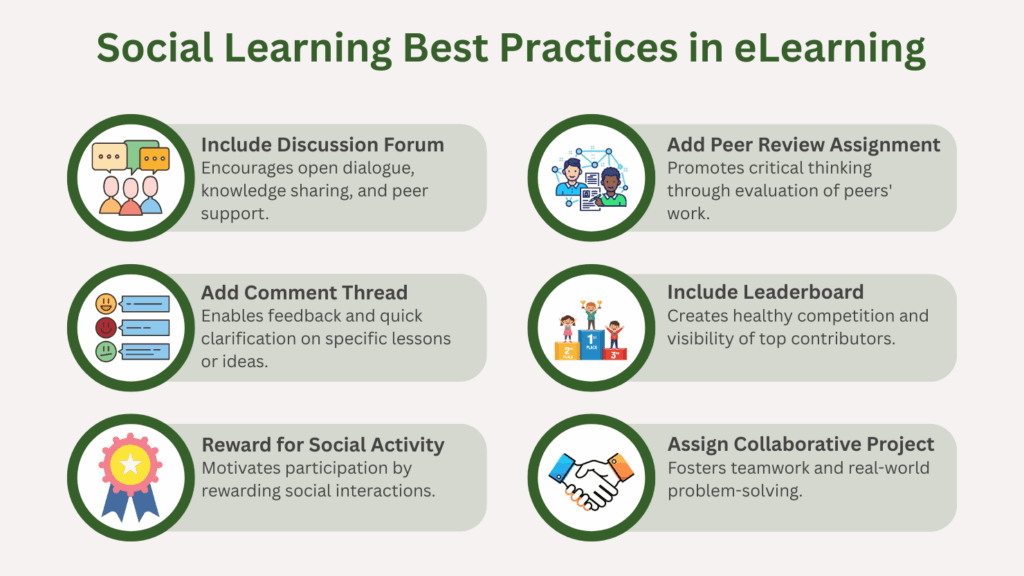
Discussion Board Depth
Most online courses have some kind of forum or discussion board. Older systems just counted posts. Newer platforms are smarter. They look at how long a post is, how many classmates replied to it, and how many times the original poster came back to respond to those replies.
A study by the University of Central Florida found that incorporating discussion boards into eLearning courses significantly increased learner engagement compared to content-only formats. But not all discussion board activity is equal. A student who posts one sentence to fulfill a participation requirement is not doing the same thing as one who writes three paragraphs and then responds thoughtfully to two classmates.
Some platforms now use AI to analyze whether a discussion post contains an original argument or just a surface-level observation. That is a level of analysis that was not possible a decade ago.
Peer Reviews
When students grade each other’s work, platforms can track how detailed those reviews are, how often reviewers give specific versus vague feedback, and whether the feedback actually improves the work in the next draft. Peer feedback is particularly valuable in creative fields like writing or design. The same principle applies across subjects. A student who writes a thoughtful peer review has clearly understood the assignment well enough to evaluate someone else’s attempt.
Live Session Participation
For courses that include live video sessions, webinars, or virtual office hours, platforms can track chat activity, polling responses, and even how long a student kept their camera on. These data points together paint a picture of engagement that is much richer than simple attendance.
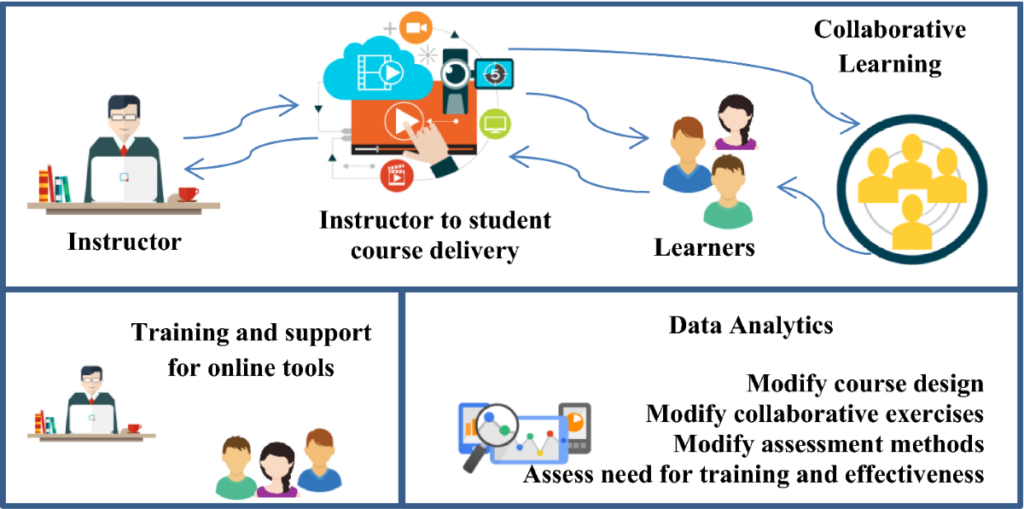
The Social Side of Learning: Why It Changes Everything
One thing that separates strong online platforms from weak ones is how well they handle the social dimension of learning. People do not learn in isolation. We learn by explaining things to others, by arguing about ideas, by asking questions and hearing different answers.
Social learning platforms recognize that learning is not a solitary activity. It thrives in social contexts where individuals can share knowledge, observe others, and engage in meaningful dialogue.
Albert Bandura, the psychologist whose Social Learning Theory shaped a lot of modern education research, argued that people learn by observing, imitating, and modeling. Online platforms that take this seriously build features that let students do exactly that in a digital space.
Cooperative learning strategies like group discussions and peer tutoring have been shown to increase knowledge retention by up to 60% compared to individual learning methods, according to a meta-analysis published in the Journal of Educational Psychology. That is not a small number.
Platforms that track these social interactions are not being invasive. They are trying to understand what is actually working and for whom.
Predictive Analytics: Catching Struggling Students Before They Fall Behind
This is where things get genuinely impressive. Modern platforms do not just report what happened. They try to predict what is about to happen.
By combining data points like login frequency, quiz performance, time on task, and discussion participation, platforms can generate an “engagement score” for each student. A student whose score starts dropping even before they fail a quiz is someone who probably needs support now, not after the test.
This kind of early warning system has real value. An instructor who gets a notification that six students have disengaged from the current module can reach out proactively, before those students decide to quit entirely.
Platforms also use this data to adapt the learning experience in real time. If a student keeps getting a certain type of question wrong, the system can automatically assign supplementary resources or route them to a different explanation of the same concept. This is called adaptive learning, and it is driven entirely by the behavioral data the platform has been collecting.
What Interactivity Levels Actually Mean in Practice
Interactivity levels in eLearning range from passive to full interactivity. At the passive level, students navigate basic content and watch videos. At the limited level, simple clickable elements and drag-and-drop activities appear. Moderate interactivity introduces branching scenarios and custom simulations. Full interactivity incorporates highly immersive experiences like virtual reality simulations and advanced gamification.
Each level generates different kinds of data. A student in a passive course produces mostly navigation and time data. A student in a fully interactive course produces data on decision-making, reaction time, mistake patterns, and recovery from errors. The second dataset tells you dramatically more about learning.
Gamification in eLearning, which applies game design mechanics like points, badges, leaderboards, and challenges to non-game contexts, can increase learner motivation, engagement, and knowledge retention. Every interaction in a gamified system is a data point. Every choice, every retry, every level completed creates a record of how a student is progressing.
How We Track Meaningful Learning on Flipgrid
Flipgrid works differently from most platforms, and that difference is worth explaining carefully.
Where most platforms track what students read or click, we track what students say. Flipgrid is a video discussion platform where students respond to prompts by recording short video clips. At its core, Flipgrid intends to improve students’ learning by maximizing student talking time. The idea is that students who have to verbalize their thinking are doing something fundamentally deeper than students who select an answer from a dropdown.
The Grid System
Teachers create a grid for a class or group, then post topics with instructions or video prompts. Students access the topic using a unique code, record and share their videos in response, and teachers can then view the videos and respond with feedback or further questions.
This creates a clear, trackable conversation. We can see who responded, how long their response was, how many peers they engaged with, and how the discussion developed over time.
How Video Responses Reveal Real Thinking
When a student records a video response, a lot becomes visible that would never show up in a typed quiz answer. Their level of confidence, whether they pause and search for words, whether they can explain a concept fluently or only haltingly, all of this is information about their level of mastery.
Students can record their responses as many times as they need before posting. When they feel comfortable with one version, they submit it. This gives them more time and space to give their take on a discussion. Teachers reviewing those submissions are not just grading the final video. They are seeing a finished product that the student chose to share, which itself is a form of self-assessment.
Peer Replies as Interaction Data
Rather than just responding to the teacher’s prompt, students on Flipgrid also reply to each other’s videos. This is where the real social learning tracking happens. We can see which students are actively engaging with their classmates’ ideas, which discussions generated the most back-and-forth, and which prompts resulted in shallow one-off responses versus deep conversations.
The platform enables learners to revisit discussions, reflect on their learning, and engage with peers meaningfully. That revisiting behavior is itself trackable. A student who comes back to watch their own video and their classmates’ responses after the initial submission is demonstrating a metacognitive habit that many platforms never get to observe.
Self-Reflection Features
Students can review their own posted videos, analyze their body language and thought process, and build self-assessment and metacognitive skills. This is genuinely unusual in educational technology. Most platforms ask students to evaluate what they know. We create a situation where students can watch themselves explain something and judge for themselves whether they actually know it.
Dashboard Analytics for Educators
Teachers can use the platform’s dashboard to track views, total discussion time, and the number of replies. This helps monitor which topics sparked the most robust conversations. An instructor looking at a dashboard that shows one topic generated 40 peer replies and another generated 3 immediately knows something about those two topics. One is generating discussion and thought. The other is not.
Private Feedback That Feels Personal
One of the features we are most proud of is the ability for teachers to send private video replies back to individual students. This adds a personal touch to corrections, making feedback encouraging and reducing the fear of criticism in front of peers. That emotional element matters. Students who receive warm, specific feedback are more likely to apply it and try again, which generates more interaction data, which gives teachers a better picture of whether the feedback actually worked.
Screen Recording for Demonstrating Thinking
The screen recording and whiteboard features allow students to “teach” a concept or walk the class through their math or science problem-solving process. When a student records themselves working through a problem out loud on a whiteboard, they are not just demonstrating a result. They are demonstrating a process. That is a much richer learning interaction to track and assess than a correct answer on a multiple choice question.
Shorts for Creative Engagement
Flipgrid Shorts allows teachers and students to edit their videos before uploading them, adding stickers, emojis, and text to attach more information. Students use their creativity to express their understanding of the lesson, making it a handy tool for audio and visual learners.
Integration With Existing School Systems
Flipgrid integrates with Microsoft Teams and Google Classroom, allowing teachers to manage assignments efficiently within existing systems. This means the interaction data we collect does not sit in isolation. It connects with everything else a teacher already uses to manage their class.
Things Platforms Still Cannot Track (and Why It Matters)
Honest disclosure: no platform tracks everything. There are several dimensions of learning that remain invisible to even the best systems right now.
The moment something clicks mentally for a student does not generate a data point. The connections a student makes between what they learned last week and what they are reading right now cannot be measured. The quality of thinking happening during an “untracked” moment, like a walk after a video lecture, is completely invisible.
This is why tracking data should always be paired with human judgment. A teacher looking at a dashboard of engagement scores is seeing something useful, but they are not seeing everything. The data should inform their attention, not replace it.
Frequently Asked Questions
Can an online platform really tell if I am actually learning, or just completing things?
Partially, yes. Platforms that track time on specific sections, video rewind behavior, quiz attempt patterns, and discussion depth can get a reasonable picture of genuine engagement. But they cannot confirm that the knowledge was transferred fully. They can identify signs of struggle or signs of fluency, and that is already much better than tracking completions alone.
What is an LMS and how does it track interactions?
LMS stands for Learning Management System. It is the software that runs online courses. When you log in, open a video, take a quiz, or post on a forum, the LMS records those actions. Older systems just logged that they happened. Newer ones log timing, sequence, frequency, and in some cases even response quality.
Does Flipgrid work for students who are nervous about being on camera?
Yes. Students who are hesitant to speak in traditional discussions often feel more comfortable expressing themselves through video because they can record as many times as needed before submitting. The lack of a live audience removes a significant barrier for shy learners.
What is adaptive learning and how does it use tracking data?
Adaptive learning is when a platform automatically adjusts what content it shows you based on your performance data. If you keep struggling with one type of problem, the system routes you to more practice on that specific thing. The tracking data is what makes this possible. Without knowing where you are struggling, the system cannot adjust anything.
Is it an invasion of privacy for a platform to track all these details?
This is a real and reasonable concern. Most reputable educational platforms are transparent about what data they collect and why. The data is supposed to be used to help students learn better, not to profile them for other purposes. Institutions using these platforms should have clear privacy policies that explain this. If a platform is not transparent about its data practices, that is a red flag.
Can teachers see everything a student does on a platform?
That depends on the platform and how it is set up. In most cases, teachers can see engagement data, participation records, and assessment results. They cannot usually see drafts that were deleted, or how many times a student started a video before getting one they liked.
What is the best type of learning interaction to show a student really learned something?
Most researchers would say the strongest signal is when a student can teach the concept to someone else. When they can explain it in their own words, answer follow-up questions, and apply it to a new situation, that is good evidence of real learning. Video discussion platforms like Flipgrid are specifically built to create and capture exactly those moments.
Tracking meaningful learning is not about surveillance. It is about giving teachers useful information and giving students feedback that actually helps. The platforms that do it well are the ones that move beyond checkboxes and look at the full texture of how a student is engaging with ideas. That is harder to build, but it is what actually makes online education work.